4 Ways to Identify Outliers
Outliers, in the context of data analysis, are those anomalous data points that significantly deviate from the general pattern or trend. Identifying and understanding outliers is crucial for accurate data interpretation and ensuring the reliability of analytical models. This comprehensive guide explores four effective methods to detect and manage outliers in your data, each offering a unique perspective and approach.
1. Visual Inspection and Plotting Techniques
The first and perhaps most intuitive way to identify outliers is through visual inspection. Plotting your data using various techniques can reveal anomalies that might otherwise go unnoticed. Here’s how you can utilize visual methods to identify outliers:
- Box Plots (Box-and-Whisker Plots): These plots provide a clear visual representation of the distribution of your data. The box represents the interquartile range (IQR), with the median as the line dividing the box. The whiskers extend to the highest and lowest values within 1.5 times the IQR. Points beyond this range are potential outliers.
- Scatter Plots: When dealing with multiple variables, scatter plots can be incredibly useful. Outliers often appear as points that are far removed from the general pattern or cluster of data points.
- Time Series Plots: For time-dependent data, plotting your data over time can help identify anomalies or trends that might indicate outliers.
- Histogram and Density Plots: These plots can help identify data points that fall outside the normal distribution, especially if your data is approximately normally distributed.
Visual inspection is a powerful tool, especially when coupled with domain knowledge. It allows you to quickly identify potential outliers and gain insights into the nature of your data.
Example: Visual Identification of Outliers
Consider a dataset containing monthly sales figures for a retail store. By plotting the sales data over time, you might notice a significant spike or drop in sales during a particular month. This visual anomaly could be an indicator of an outlier.
| Month | Sales |
|---|---|
| January | 1200 |
| February | 1150 |
| March | 1500 |
| April | 980 |
| May | 1350 |
2. Statistical Methods for Outlier Detection
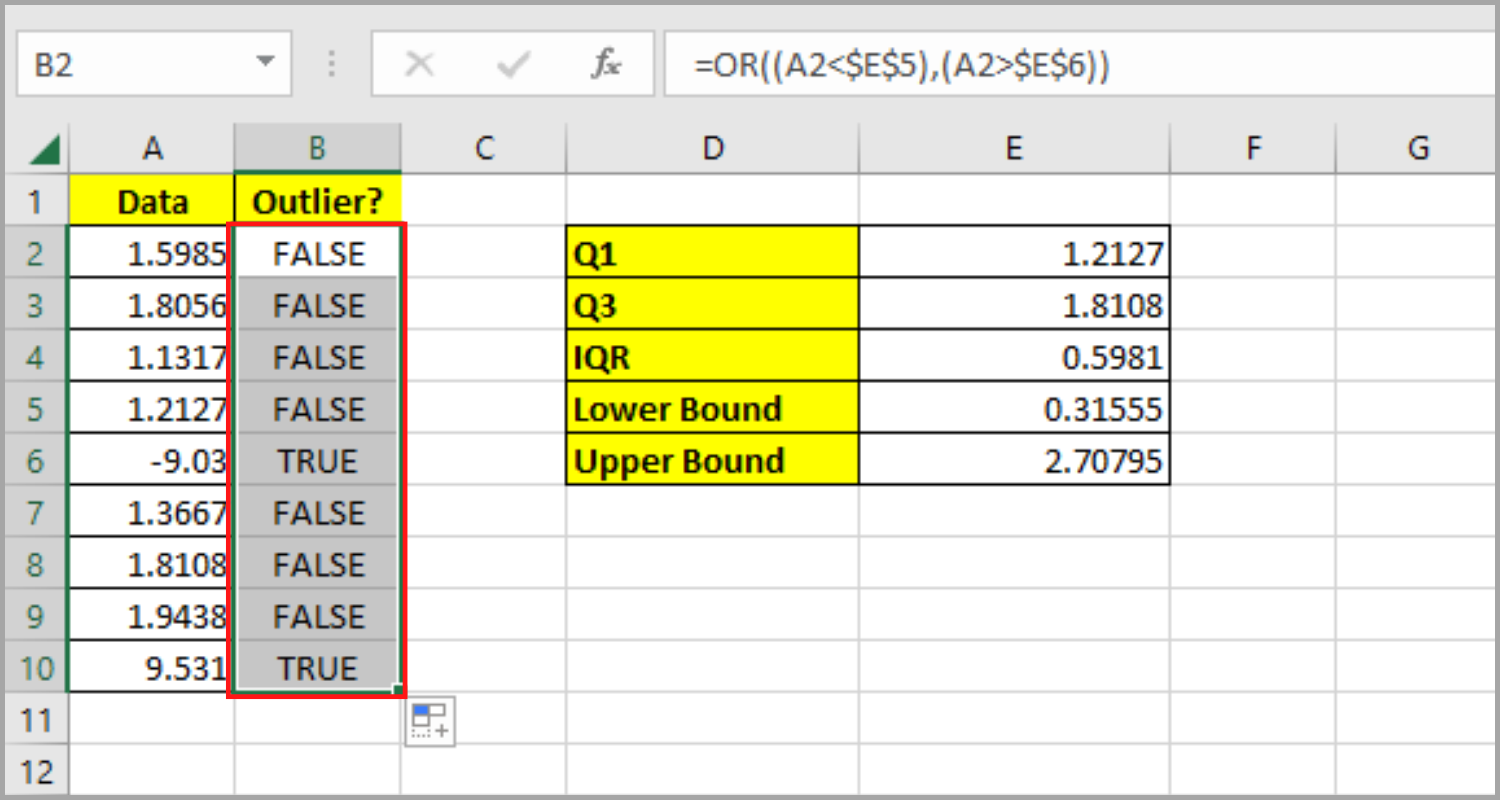
Statistical methods provide a more systematic approach to identifying outliers. These methods use mathematical formulas and algorithms to quantify the deviation of data points from the overall pattern.
- Z-Score Method: This method standardizes the data by calculating the Z-score for each data point. A Z-score greater than 3 or less than -3 often indicates an outlier. The formula for Z-score is: Z = (X - μ) / σ, where X is the data point, μ is the mean, and σ is the standard deviation.
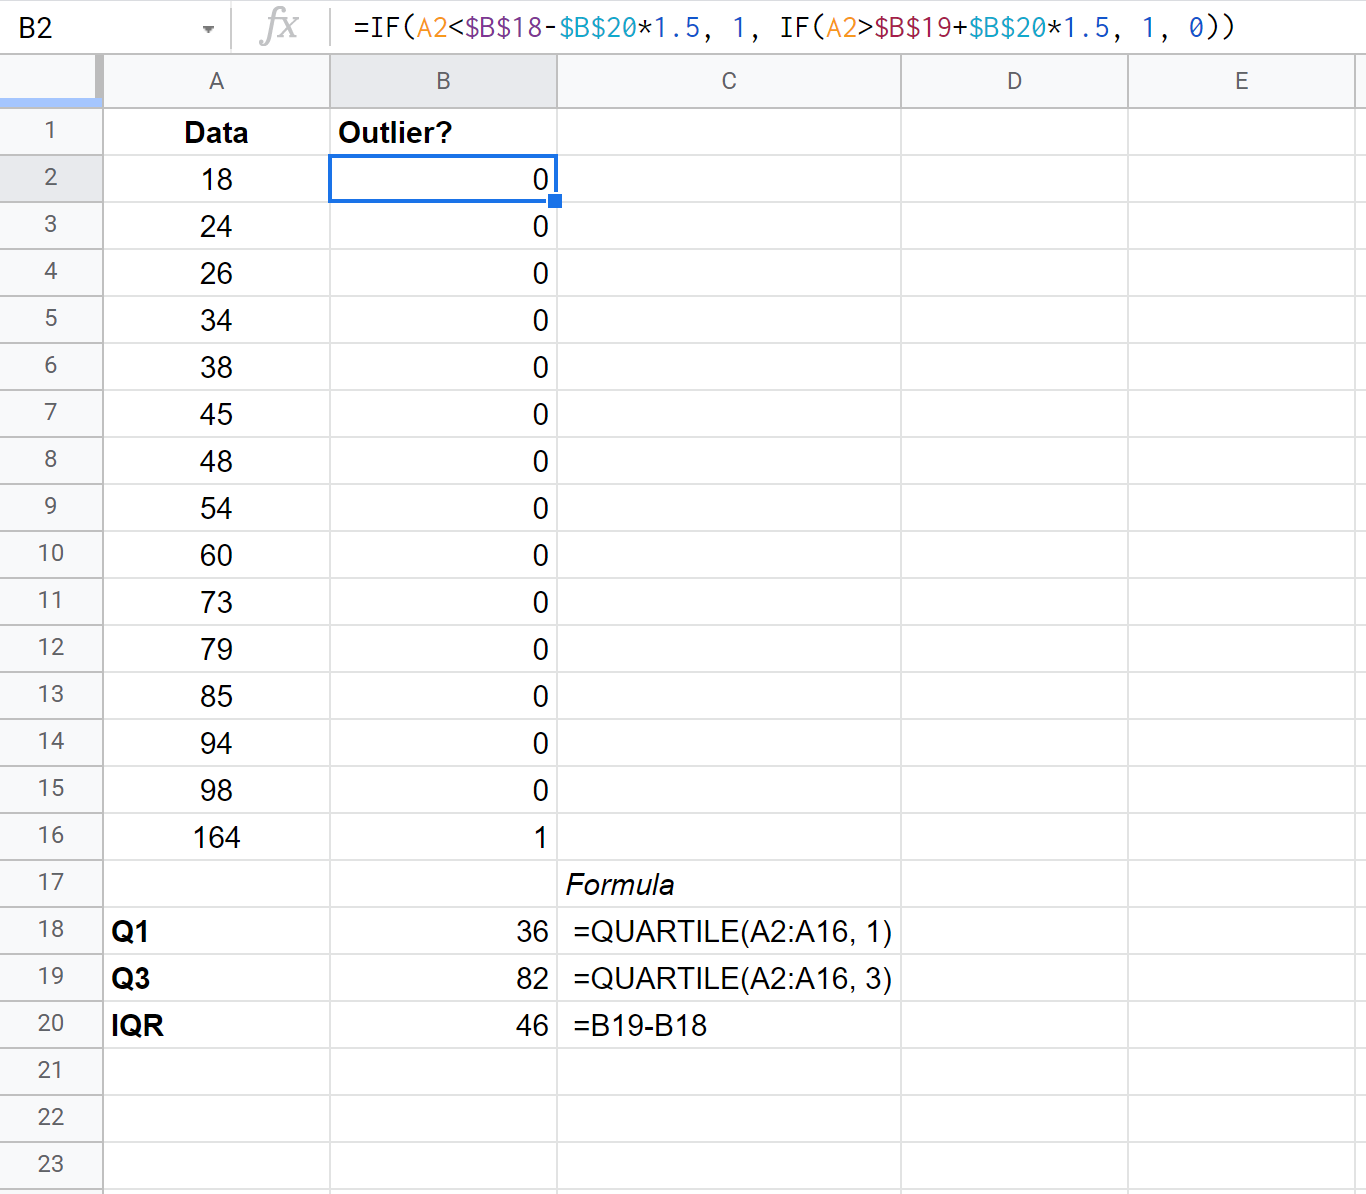
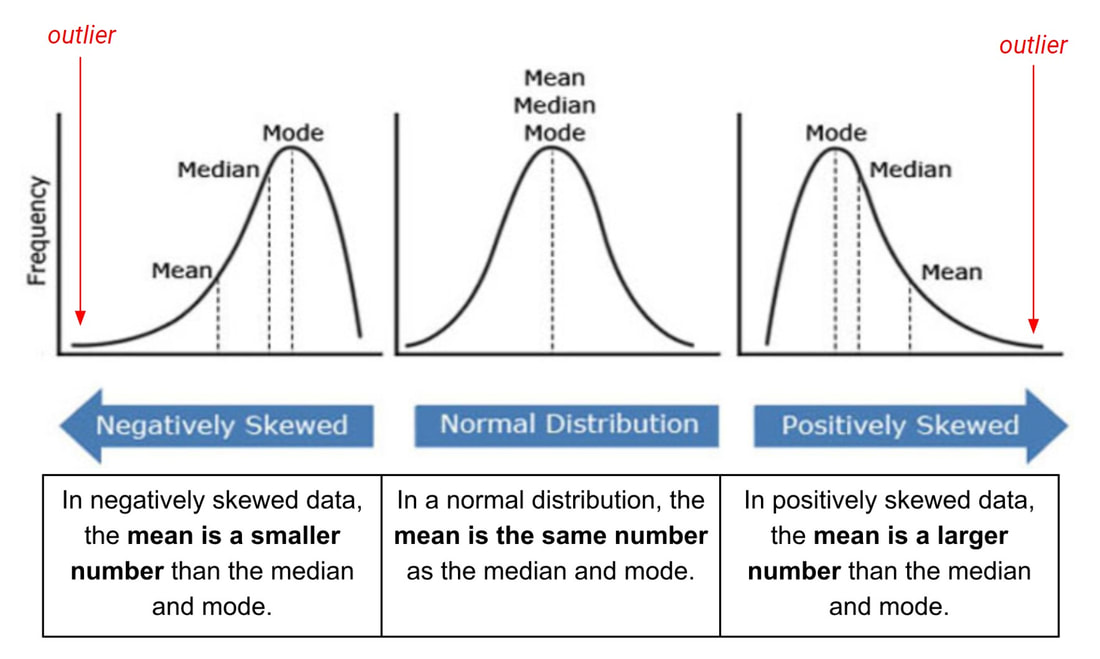
- IQR Method: The Interquartile Range (IQR) method is particularly useful for detecting outliers in skewed distributions. It calculates the IQR and identifies any data points that fall outside the range of Q1 - 1.5*IQR and Q3 + 1.5*IQR as potential outliers.
- Modified Z-Score Method: This method is more robust than the standard Z-score method and is particularly useful for detecting outliers in large datasets. The formula for modified Z-score is: MZ = 0.6745 * (X - median) / MAD, where MAD is the Median Absolute Deviation.
- Probabilistic Methods: These methods use probability distributions to assess the likelihood of a data point being an outlier. Examples include the Grubbs’ test and the Dixon’s Q-test.
Statistical methods offer a more objective approach to outlier detection, but they may require a deeper understanding of statistics and careful interpretation.
Example: Statistical Outlier Detection
Let’s consider a dataset containing student test scores. By calculating the Z-score for each score, we can identify potential outliers. A Z-score greater than 2 or less than -2 might indicate an outlier.
| Student | Test Score | Z-Score |
|---|---|---|
| Alice | 85 | 0.5 |
| Bob | 92 | 1.2 |
| Carol | 78 | -0.8 |
| David | 98 | 2.1 |
| Eve | 82 | -0.3 |
3. Domain Knowledge and Contextual Analysis
Domain knowledge and contextual analysis play a crucial role in outlier detection. Understanding the underlying context and nature of your data can help identify anomalies that might not be apparent through purely statistical methods.
- Data Understanding: Take the time to thoroughly understand your data. Know the range of expected values, the potential sources of variability, and the possible causes of outliers.
- Contextual Analysis: Consider the context in which the data was collected. For example, a particularly high sales figure during a holiday season might not be an outlier but rather an expected trend.
- Data Quality Checks: Implement data quality checks to identify potential errors or inconsistencies. This could involve checking for missing values, duplicate entries, or data entry errors.
- Expert Opinion: Consult with domain experts or individuals with deep knowledge of the data. Their insights can help identify anomalies or explain the presence of outliers.
Contextual analysis ensures that your outlier detection process is grounded in reality and aligns with the nature of your data.
Example: Contextual Analysis for Outlier Detection
In a dataset containing customer feedback ratings, a particularly low rating might be an outlier. However, upon further investigation, it could be revealed that the low rating was given by a customer who had a known issue with the product, making it a valid data point rather than an outlier.
4. Machine Learning and Advanced Techniques
Machine learning and advanced statistical techniques offer sophisticated methods for outlier detection, especially in high-dimensional and complex datasets.
- Clustering Algorithms: Clustering algorithms, such as K-Means or DBSCAN, can identify clusters of data points and highlight those that do not fit into any cluster as potential outliers.
- Isolation Forest: This algorithm isolates outliers by randomly partitioning the data. Outliers are more likely to be isolated earlier in the partitioning process.
- One-Class SVM: The One-Class Support Vector Machine (OCSVM) is a supervised learning algorithm that learns the boundary of the majority class and identifies data points outside this boundary as outliers.
- Autoencoders: Autoencoders, a type of neural network, can be used to detect anomalies by reconstructing input data. Outliers tend to have higher reconstruction errors.
These advanced techniques are particularly useful for complex, high-dimensional data, but they may require more computational resources and expertise to implement.
Example: Machine Learning for Outlier Detection
Consider a dataset containing customer purchase data. By using a clustering algorithm like DBSCAN, you can identify clusters of similar purchases. Data points that do not fit into any cluster can be flagged as potential outliers.
Conclusion: A Holistic Approach to Outlier Detection

Outlier detection is a critical aspect of data analysis, and employing a holistic approach that combines visual inspection, statistical methods, domain knowledge, and advanced techniques is essential. Each method offers unique insights and should be used contextually to ensure accurate and reliable results.
By understanding the strengths and limitations of each approach, data analysts and scientists can effectively identify and manage outliers, leading to more robust and reliable data analysis and decision-making.
Frequently Asked Questions
How do I decide which outlier detection method to use for my dataset?
+The choice of outlier detection method depends on several factors, including the nature of your data, the size of your dataset, and the specific goals of your analysis. Visual inspection methods are often a good starting point, especially for smaller datasets or when domain knowledge is available. For larger datasets or when dealing with complex, high-dimensional data, statistical methods and advanced techniques like machine learning algorithms may be more appropriate.
Can outliers provide valuable insights or be a source of useful information?
+Absolutely! Outliers can provide valuable insights into the data, especially when they are properly understood and analyzed. They can indicate unusual or exceptional cases, highlight potential issues or errors in the data collection process, or reveal interesting trends or patterns. However, it’s important to approach outliers with caution and carefully investigate their context before drawing conclusions.
What are some common challenges or pitfalls in outlier detection?
+One common challenge is the potential for overfitting, especially when using complex statistical or machine learning methods. This can lead to the misidentification of legitimate data points as outliers. Another pitfall is the reliance on a single outlier detection method without considering the context or domain knowledge. It’s important to use a combination of methods and validate the identified outliers through careful analysis.
How can I handle outliers once they have been identified?
+The handling of outliers depends on the specific context and goals of your analysis. In some cases, it may be appropriate to remove outliers from the dataset if they are deemed to be errors or irrelevant. In other cases, it might be more beneficial to transform the data or use robust statistical methods that are less sensitive to outliers. The key is to make informed decisions based on the nature of the outliers and the specific requirements of your analysis.
