Excel P-Value Calculation Made Easy
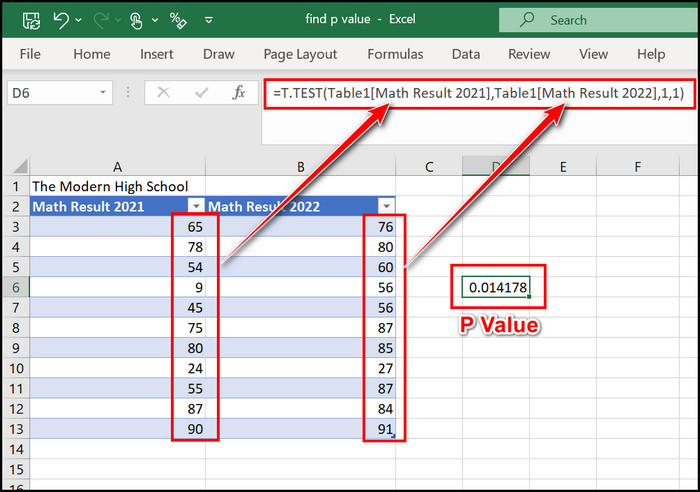
Excel is a powerful tool for data analysis, and one of its essential functions is the calculation of p-values. The p-value is a fundamental concept in statistical hypothesis testing, helping us understand the significance of our findings. In this article, we will delve into the world of Excel p-value calculation, exploring its significance, the different methods to obtain p-values, and providing practical examples to make your data analysis journey a breeze.
Understanding the Significance of P-Values
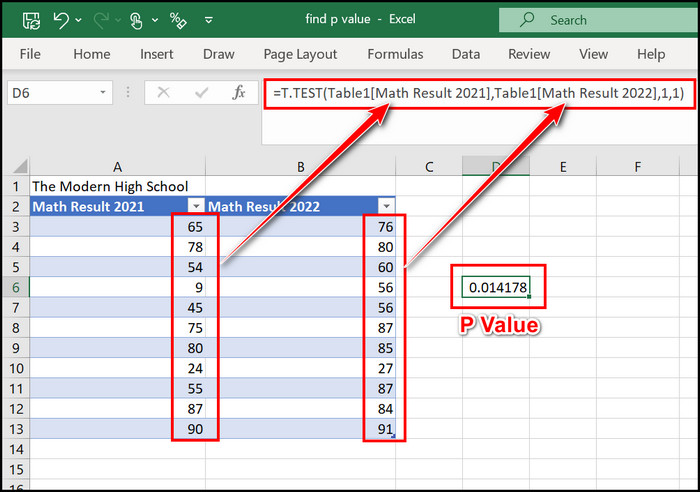
Before we dive into the calculation methods, let’s establish a solid foundation by understanding what p-values represent. In statistics, a p-value is a numerical measure used to determine the statistical significance of an observed effect or result. It helps us answer the question: “How likely is it that our observed data could have occurred by chance alone?”
P-values are commonly used in hypothesis testing to make decisions about whether to accept or reject a null hypothesis. A null hypothesis represents a statement of no effect or no difference, and the p-value quantifies the strength of evidence against this hypothesis. In essence, the p-value helps us assess the probability of obtaining our observed results, or more extreme results, if the null hypothesis is true.
For example, let's say we want to determine if a new marketing strategy has increased sales significantly. We can collect data on sales before and after implementing the strategy and calculate a p-value. If the p-value is small (usually below a predefined significance level, such as 0.05), we have strong evidence to reject the null hypothesis and conclude that the new strategy has a significant impact on sales.
Methods to Calculate P-Values in Excel
Excel provides various functions and tools to calculate p-values, making it an accessible and user-friendly platform for statistical analysis. Here are some commonly used methods:
T.DIST and T.DIST.2T Functions
The T.DIST and T.DIST.2T functions are used to calculate the p-value for a Student’s t-test, a common statistical test for comparing means or testing hypotheses about population means. These functions require the input of the t-statistic and the degrees of freedom. For example, to calculate a one-tailed p-value for a t-statistic of 2.5 with 20 degrees of freedom, we can use the formula:
P-value = T.DIST(2.5, 20, 1)
Similarly, the T.DIST.2T function can be used for two-tailed p-values.
CHISQ.DIST Function
The CHISQ.DIST function calculates the p-value for a chi-square test, which is often used to assess the goodness of fit between observed and expected frequencies or to test independence between categorical variables. It takes the chi-square statistic and the degrees of freedom as inputs. For instance, to find the p-value for a chi-square statistic of 7.2 with 3 degrees of freedom, we use:
P-value = CHISQ.DIST(7.2, 3, TRUE)
F.DIST and F.DIST.RT Functions
The F.DIST and F.DIST.RT functions are employed to calculate p-values for the F-test, typically used to compare the variances of two populations or to test hypotheses about population variances. The F-statistic and the degrees of freedom are required inputs. To obtain a one-tailed p-value for an F-statistic of 3.5 with 10 and 5 degrees of freedom, we can apply the following formula:
P-value = F.DIST(3.5, 10, 5, 1)
Z.DIST Function
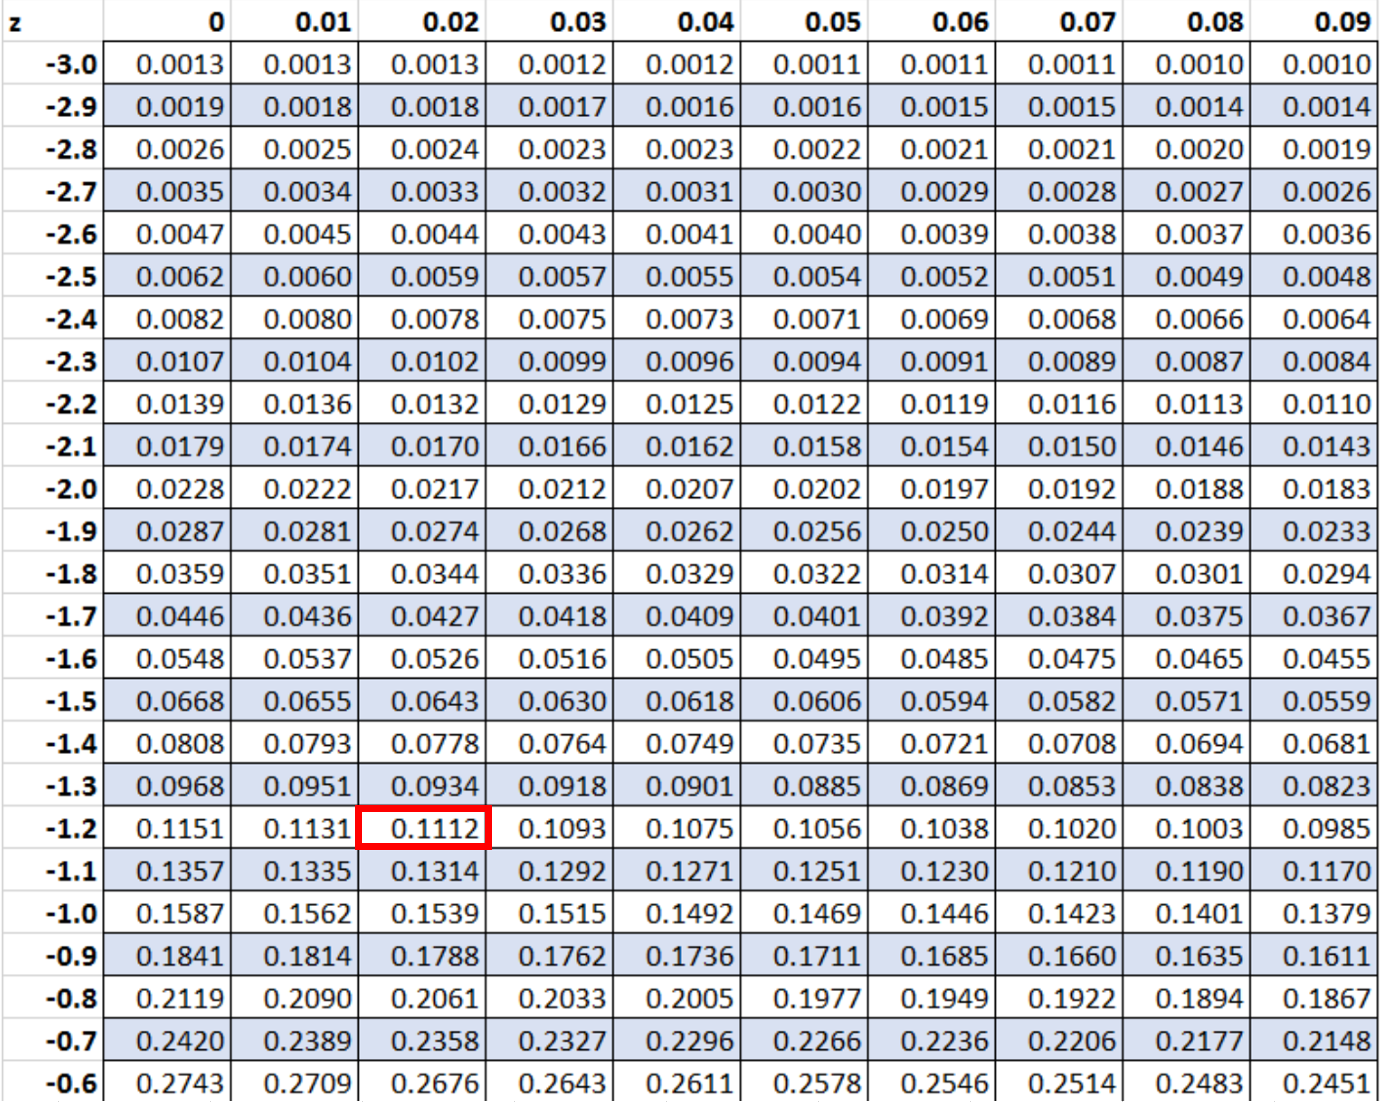
The Z.DIST function is utilized to calculate p-values for the standard normal distribution, which is commonly employed in z-tests for testing hypotheses about population means or proportions. The formula requires the z-score and the tail type (one-tailed or two-tailed) as inputs. For instance, to find the p-value for a z-score of -1.2 with a two-tailed test, we use:
P-value = 2 * (1 - NORM.DIST(-1.2, 0, 1, TRUE))
Practical Examples
Let’s walk through a few practical examples to illustrate the application of these functions in Excel.
Student’s t-test for Comparing Means
Suppose we have two groups of students, and we want to determine if there is a significant difference in their average test scores. We collect data on the test scores of 20 students from each group and calculate the t-statistic. Let’s say the t-statistic is -2.75 with 38 degrees of freedom. We can use the T.DIST function to find the p-value:
P-value = T.DIST(-2.75, 38, 2)
If the calculated p-value is less than our predefined significance level (e.g., 0.05), we can reject the null hypothesis and conclude that there is a significant difference in the average test scores between the two groups.
Chi-Square Test for Goodness of Fit
Imagine we have data on the colors of marbles drawn from a bag. We want to test if the observed color distribution matches our expected distribution. We record the counts of each color and calculate the chi-square statistic. Let’s say the chi-square statistic is 12.3 with 4 degrees of freedom. We can use the CHISQ.DIST function to obtain the p-value:
P-value = CHISQ.DIST(12.3, 4, TRUE)
If the p-value is above our significance level, we fail to reject the null hypothesis, indicating that the observed color distribution is consistent with our expected distribution.
F-test for Comparing Variances
Consider a scenario where we have two samples, and we want to determine if their population variances are significantly different. We calculate the F-statistic from the sample variances. Let’s assume the F-statistic is 3.2 with 12 and 8 degrees of freedom. We can employ the F.DIST function to find the p-value:
P-value = F.DIST(3.2, 12, 8, 1)
If the p-value is below our significance level, we can reject the null hypothesis and conclude that the population variances of the two samples are indeed different.
Tips and Considerations
When working with p-values in Excel, it’s essential to keep a few considerations in mind:
- Significance Level: Choose an appropriate significance level (e.g., 0.05 or 0.01) based on your field and research standards. This level determines the threshold for rejecting the null hypothesis.
- Multiple Testing: If you perform multiple tests, be cautious of the increased likelihood of Type I errors. Adjustments like the Bonferroni correction can help control the overall error rate.
- Data Assumptions: Ensure your data meets the assumptions of the statistical test you are conducting. For example, normality assumptions are critical for t-tests and ANOVA.
- Interpretation: Remember that a small p-value does not imply causation. It only indicates the likelihood of obtaining the observed results under the null hypothesis. Correlation does not always imply causation.
Conclusion
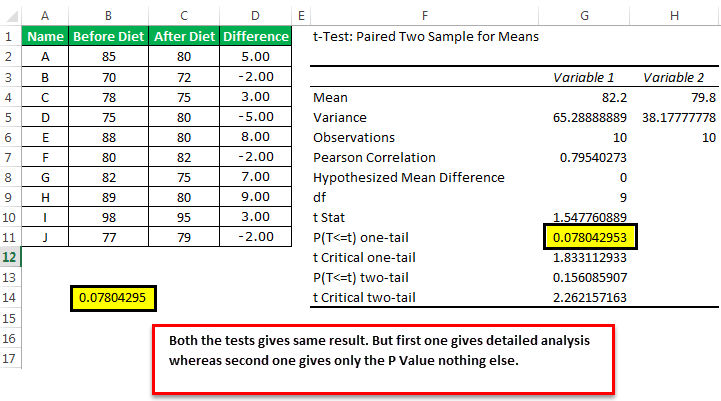
Excel’s p-value calculation functions empower users to conduct statistical hypothesis testing with ease. By understanding the significance of p-values and the various methods to calculate them, you can make informed decisions about your data. Whether you’re comparing means, testing goodness of fit, or assessing variances, Excel provides the tools to analyze your data effectively. With the knowledge gained from this article, you’re well-equipped to explore and interpret your data with confidence.
How do I choose the correct p-value calculation function in Excel?
+The choice of function depends on the statistical test you are performing. T.DIST and T.DIST.2T are for t-tests, CHISQ.DIST for chi-square tests, F.DIST and F.DIST.RT for F-tests, and Z.DIST for z-tests. Ensure you understand the assumptions and requirements of each test before selecting the appropriate function.
What is the significance level, and how do I choose it?
+The significance level, often denoted as alpha (α), is the threshold probability for rejecting the null hypothesis. Common values include 0.05 and 0.01. The choice depends on your field and research standards. A lower significance level increases the stringency of your test.
How do I interpret a p-value in the context of my analysis?
+A p-value indicates the likelihood of obtaining your observed results (or more extreme results) if the null hypothesis is true. If the p-value is below your chosen significance level, you have strong evidence to reject the null hypothesis. However, remember that p-values do not provide direct evidence of causation.

