Mastering the TI-84 Normal CDF Function

The TI-84 calculator, a staple in the world of mathematics and science, offers a range of powerful statistical functions that can be invaluable for students, researchers, and professionals alike. One such function is the Normal CDF (Cumulative Distribution Function), which provides an efficient way to calculate the area under a normal distribution curve. In this comprehensive guide, we will delve into the intricacies of the TI-84 Normal CDF function, exploring its applications, benefits, and step-by-step usage.
Understanding the TI-84 Normal CDF Function

The Normal CDF function on the TI-84 calculator is a statistical tool that allows users to calculate the cumulative probability of a random variable following a normal distribution. In simpler terms, it helps determine the likelihood of a value falling within a specific range in a normally distributed dataset. This function is particularly useful when working with real-world data that often follows a normal distribution pattern.
The Normal CDF function is accessible through the DISTR menu on the TI-84, offering a straightforward way to perform complex calculations. By inputting the mean, standard deviation, and the value of interest, the calculator can provide the cumulative probability, making it an essential tool for statistical analysis and decision-making.
Applications of the TI-84 Normal CDF Function

The versatility of the Normal CDF function on the TI-84 makes it applicable to a wide range of scenarios. Here are some practical use cases:
Quality Control and Manufacturing
In manufacturing processes, ensuring product quality is crucial. The Normal CDF function can be used to calculate the probability of a product falling within acceptable quality ranges. By setting the mean and standard deviation based on the desired quality standards, manufacturers can make informed decisions regarding production and quality control.
Financial Analysis and Risk Assessment
Financial professionals often work with data that follows a normal distribution, such as stock prices or interest rates. The Normal CDF function allows them to assess the risk associated with various investments. By calculating the cumulative probability of returns falling within a specific range, analysts can make more accurate predictions and informed investment decisions.
Medical Research and Healthcare
In the field of medicine, researchers and healthcare professionals often deal with data that follows a normal distribution, such as patient vitals or the effectiveness of treatments. The Normal CDF function can be used to analyze the probability of certain outcomes, aiding in clinical trials, drug development, and patient care planning.
Educational Assessment
Educators can utilize the Normal CDF function to evaluate student performance and set grading standards. By analyzing the distribution of student scores and setting the mean and standard deviation accordingly, teachers can establish fair and consistent grading criteria.
Step-by-Step Guide: Using the TI-84 Normal CDF Function
Let’s walk through the process of using the Normal CDF function on the TI-84 calculator. We’ll use a practical example to illustrate each step.
Step 1: Accessing the Function
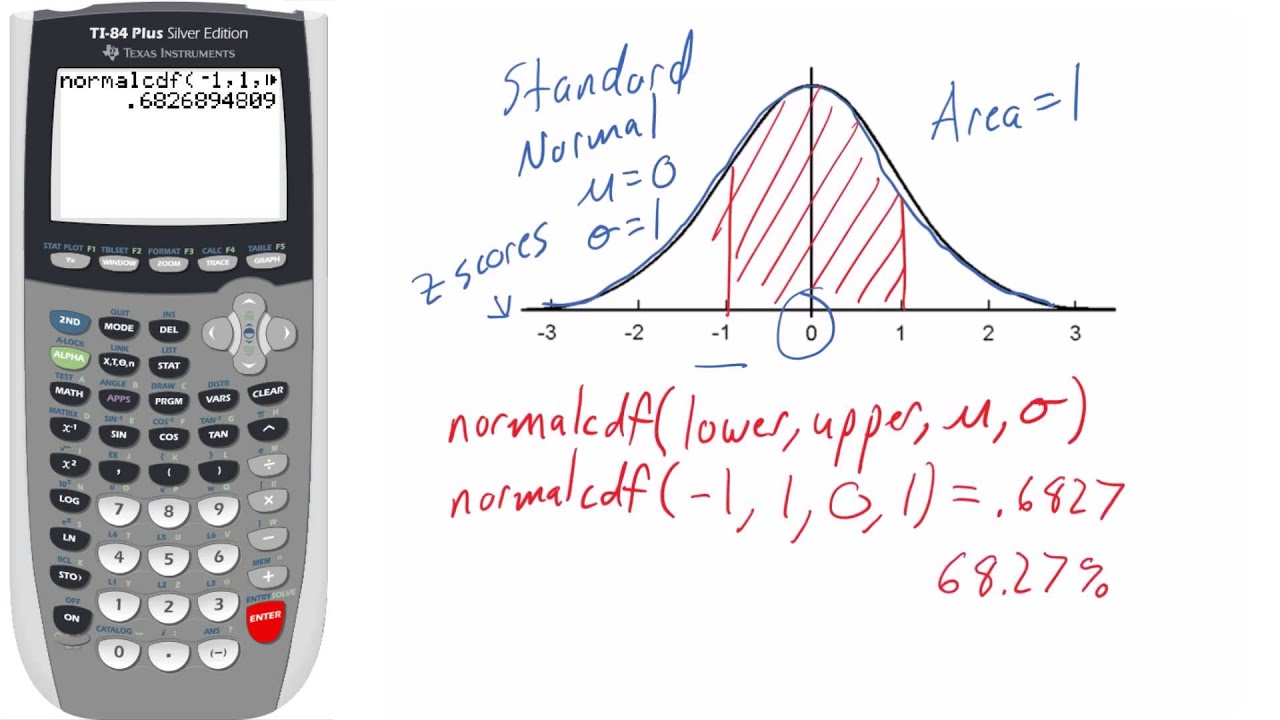
Begin by pressing the [2nd] button, followed by the [DISTR] button. This will open the distribution menu. Scroll down and select normalcdf by pressing the corresponding button.
Step 2: Inputting Parameters
The Normal CDF function requires four inputs: the lower bound (x1), the upper bound (x2), the mean (μ), and the standard deviation (σ). For our example, let’s assume we want to find the probability of a value being between 50 and 75, with a mean of 60 and a standard deviation of 5.
- Lower Bound (x1): 50
- Upper Bound (x2): 75
- Mean (μ): 60
- Standard Deviation (σ): 5
Step 3: Calculating the Cumulative Probability
With the inputs ready, press [ENTER] to initiate the calculation. The TI-84 will display the cumulative probability, which represents the area under the normal distribution curve between the lower and upper bounds.
In our example, the calculator might output a value like 0.8943, indicating that there is an 89.43% chance of a value falling between 50 and 75 in this normally distributed dataset.
Step 4: Interpreting the Result
The calculated cumulative probability provides valuable insights. In our example, the high probability suggests that the majority of values in the dataset are likely to fall within the range of 50 to 75. This information can be used to make informed decisions or draw conclusions based on the data.
Advanced Features and Considerations
The TI-84 Normal CDF function offers several advanced features and considerations to enhance its usability and accuracy.
Using Different Probability Distributions
While the Normal CDF function is designed for normally distributed data, it can also be applied to other probability distributions. By adjusting the inputs and parameters, users can adapt the function to various statistical scenarios.
Customizing the Calculator’s Settings
The TI-84 calculator allows users to customize its settings to suit their specific needs. This includes adjusting the number of decimal places displayed, the angle mode (degrees, radians, or gradians), and the contrast for better visibility.
Handling Extreme Values
When working with extreme values, such as very small or large numbers, it’s important to consider the calculator’s limitations. The TI-84 may have precision issues with extremely large or small numbers, so it’s advisable to review the calculator’s documentation for guidance on handling such cases.
Real-World Example: Application in Manufacturing

Let’s explore a real-world scenario where the TI-84 Normal CDF function is applied in a manufacturing context. Imagine a company that produces electronic components, and they want to ensure that the resistance of their products falls within a specific range.
The company has collected resistance data from a sample of their products, and they find that the resistance values follow a normal distribution with a mean of 100 ohms and a standard deviation of 5 ohms. They decide to use the Normal CDF function to assess the probability of resistance values falling within their acceptable range of 95 to 105 ohms.
By inputting the lower bound as 95, the upper bound as 105, the mean as 100, and the standard deviation as 5, the TI-84 calculator provides a cumulative probability of approximately 0.9545. This high probability indicates that the majority of their products' resistance values fall within the desired range, assuring the company of the quality of their manufacturing process.
Conclusion: Empowering Statistical Analysis
The TI-84 Normal CDF function is a powerful tool that empowers users to make data-driven decisions with confidence. By understanding its applications, following a step-by-step guide, and considering advanced features, professionals and students alike can harness the full potential of this calculator’s capabilities. Whether in manufacturing, finance, healthcare, or education, the Normal CDF function serves as a valuable asset for statistical analysis and informed decision-making.
Can the TI-84 Normal CDF function be used for other probability distributions besides the normal distribution?
+
Yes, the TI-84 Normal CDF function can be adapted for other probability distributions by adjusting the inputs and parameters accordingly. It provides a versatile tool for various statistical scenarios.
Are there any limitations to the TI-84 calculator’s precision when dealing with extreme values?
+
Yes, the TI-84 calculator may encounter precision issues with extremely large or small numbers. Users should be aware of these limitations and consult the calculator’s documentation for guidance on handling such cases.
How can I customize the settings of my TI-84 calculator to suit my preferences?
+
To customize the TI-84 calculator’s settings, navigate to the MODE menu by pressing [2nd] + [MODE]. Here, you can adjust decimal places, angle mode, and contrast to enhance your calculator experience.


