Mastering Margin of Error in Excel
Welcome to the world of data analysis and statistics, where precision and accuracy are paramount. Today, we delve into a crucial aspect of data interpretation: the Margin of Error. Understanding and calculating this statistical concept is essential for making informed decisions and drawing reliable conclusions from your data. In this comprehensive guide, we will explore the intricacies of the Margin of Error in Excel, a powerful tool that empowers professionals and enthusiasts alike to analyze data with confidence.
Whether you are a data analyst, a researcher, or simply someone curious about data-driven decision-making, this article will provide you with a deep understanding of Margin of Error and its practical applications. By the end of this journey, you will not only grasp the theoretical underpinnings but also master the art of calculating and interpreting Margin of Error in Excel, a skill that will prove invaluable in your data-related endeavors.
Unraveling the Concept of Margin of Error
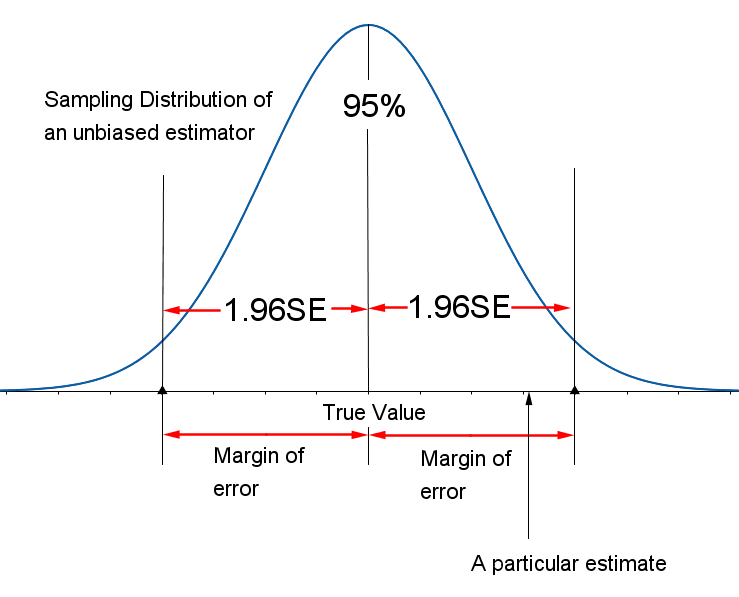
Margin of Error, often denoted as ME, is a statistical measure that quantifies the uncertainty associated with a sample estimate. In simpler terms, it represents the range of values within which the true population parameter is expected to fall, with a certain level of confidence. This concept is particularly useful when working with samples, as it provides an estimate of the variability that might exist between the sample and the entire population.
For instance, imagine you are conducting a survey to gauge the average height of adults in a city. Due to time and resource constraints, you cannot measure every individual, so you take a representative sample. The Margin of Error helps you understand how close your sample estimate is likely to be to the actual average height of the entire population. A smaller Margin of Error indicates greater precision and confidence in your estimate.
The Margin of Error is calculated based on several factors, including the sample size, the level of confidence desired, and the variability of the data. By adjusting these parameters, you can fine-tune your analysis to meet your specific needs and requirements.
Key Components of Margin of Error
- Sample Size: The number of observations or data points in your sample plays a critical role in determining the Margin of Error. Larger sample sizes generally lead to smaller Margins of Error, as they provide more accurate representations of the population.
- Confidence Level: This is the level of certainty you wish to achieve in your estimate. Commonly used confidence levels are 90%, 95%, and 99%, which correspond to different levels of risk tolerance. A higher confidence level results in a larger Margin of Error, as it accounts for a wider range of potential outcomes.
- Standard Deviation: The variability of your data, often represented by the standard deviation, is another crucial factor. Data with higher variability tend to have larger Margins of Error, as they exhibit more uncertainty.
Understanding these components is essential for interpreting Margin of Error calculations and making informed decisions based on your data.
Calculating Margin of Error in Excel
Excel, with its powerful statistical functions and user-friendly interface, is an excellent tool for calculating Margin of Error. Let’s delve into the step-by-step process, accompanied by practical examples, to master this skill.
Step 1: Prepare Your Data
Before diving into calculations, ensure your data is properly organized in an Excel spreadsheet. Create a column for your sample data and another for the corresponding standard deviation values. Here’s an example:
| Sample Data | Standard Deviation |
|---|---|
| 52 | 3.2 |
| 55 | 2.8 |
| 58 | 4.1 |
| ... | ... |
Step 2: Determine the Confidence Level
Choose the confidence level that aligns with your analysis objectives. Common choices include 90%, 95%, and 99%. For this example, let’s assume a 95% confidence level.
Step 3: Calculate the Standard Error
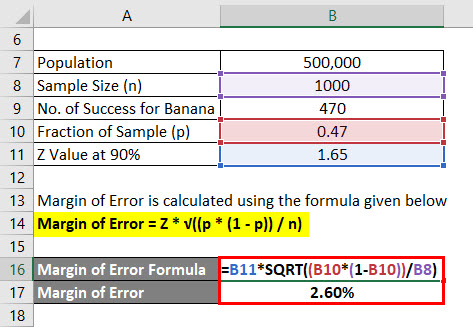
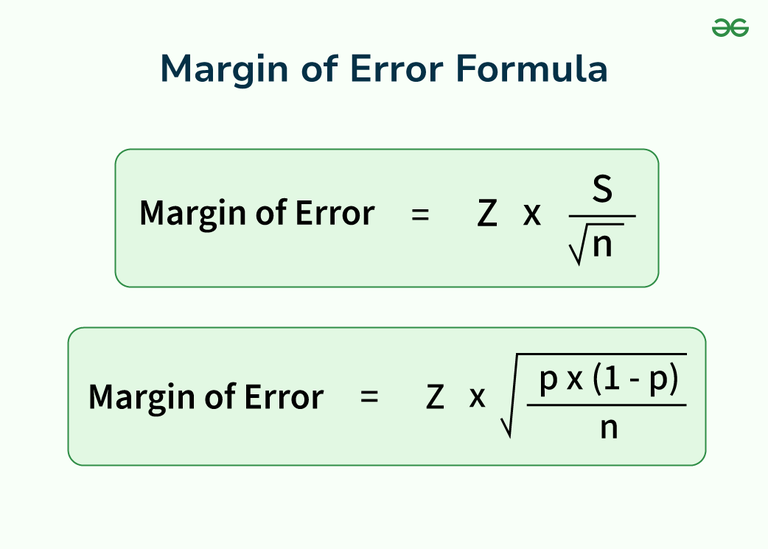
The Standard Error, denoted as SE, is a measure of the variability of your sample mean. It is calculated using the formula: SE = Standard Deviation / Square Root of Sample Size. In Excel, you can use the formula =STDEV(Sample Data)/SQRT(COUNT(Sample Data)) to compute the Standard Error.
Step 4: Compute the Margin of Error
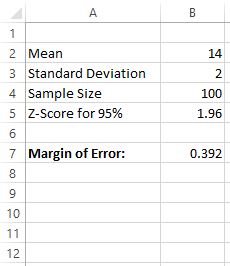
The Margin of Error is calculated using the formula: ME = Standard Error * Confidence Interval Factor. The Confidence Interval Factor depends on the chosen confidence level. For a 95% confidence level, the factor is approximately 1.96. In Excel, you can use the formula =SE*1.96 to compute the Margin of Error.
Let's apply this formula to our example data. Assuming a sample size of 100 and a standard deviation of 3.5, the calculation would be: ME = 3.5/SQRT(100) * 1.96, resulting in a Margin of Error of approximately 0.7.
Step 5: Interpret the Results
Once you have calculated the Margin of Error, interpret its meaning in the context of your data. In our example, a Margin of Error of 0.7 suggests that, with 95% confidence, the true population mean falls within a range of 0.7 units above and below the sample mean. This range provides a measure of precision for your estimate.
Applying Margin of Error in Real-World Scenarios
The concept of Margin of Error finds applications across various domains, from market research to scientific experiments. Let’s explore some practical scenarios where mastering Margin of Error in Excel can prove invaluable.
Scenario 1: Customer Satisfaction Surveys
Imagine you are a marketing analyst tasked with gauging customer satisfaction levels for a new product. By conducting a survey and calculating the Margin of Error, you can determine the precision of your findings. A small Margin of Error indicates that your survey results are reliable and representative of the entire customer base.
Scenario 2: Clinical Trials
In the realm of medical research, Margin of Error plays a critical role in clinical trials. Researchers can use Excel to calculate the Margin of Error for treatment outcomes, ensuring that the results are statistically significant and reliable.
Scenario 3: Election Polling
During election seasons, Margin of Error is a key metric for pollsters. By accurately calculating the Margin of Error, they can provide voters with a range of potential outcomes, helping to inform their decisions.
Advanced Techniques for Margin of Error Calculations
While the basic formula for Margin of Error provides a solid foundation, advanced techniques can further enhance your analysis. Here are some additional considerations to explore:
Adjusting for Different Confidence Levels
Excel allows you to easily adjust the Confidence Interval Factor based on your desired confidence level. For instance, a 99% confidence level would require a larger factor, resulting in a wider Margin of Error.
Accounting for Unequal Variances
In some cases, your data may exhibit unequal variances across different groups or conditions. Excel offers functions like STDEV.S and STDEV.P to calculate standard deviations for small and large samples, respectively, ensuring accurate calculations.
Handling Non-Normal Distributions
When dealing with non-normal distributions, such as skewed data, alternative statistical methods like bootstrapping can be employed to estimate Margin of Error. Excel add-ins or specialized software may be required for these advanced techniques.
Best Practices for Interpreting Margin of Error
As you delve deeper into Margin of Error calculations, it’s essential to keep the following best practices in mind:
- Understand the Context: Always interpret Margin of Error in the context of your specific analysis. Consider the sample size, data variability, and the chosen confidence level to draw meaningful conclusions.
- Consider Multiple Sources: Margin of Error is just one aspect of statistical analysis. Complement your findings with other statistical measures and visualizations to gain a comprehensive understanding of your data.
- Communicate Clearly: When presenting your results, ensure that the Margin of Error is clearly communicated to stakeholders. Explain its significance and how it affects the reliability of your estimates.
FAQ
What is the difference between Margin of Error and Standard Error?
+Margin of Error (ME) and Standard Error (SE) are related concepts but serve different purposes. Standard Error measures the variability of the sample mean, while Margin of Error provides a range within which the true population parameter is expected to fall with a certain level of confidence.
How does sample size affect Margin of Error?
+Sample size plays a crucial role in determining Margin of Error. Larger sample sizes generally result in smaller Margins of Error, as they provide more accurate representations of the population. This relationship emphasizes the importance of collecting sufficient data to enhance the precision of your estimates.
Can Margin of Error be negative?
+No, Margin of Error cannot be negative. It represents a range of values, and negative values would not make sense in this context. If your calculations yield a negative result, review your data and formulas to identify and rectify any errors.
How can I improve the precision of my Margin of Error calculations?
+To improve precision, consider increasing your sample size. Larger samples generally lead to smaller Margins of Error. Additionally, ensure your data is representative of the population and exhibits minimal variability. Finally, select a higher confidence level, although this will result in a wider Margin of Error.
In conclusion, mastering Margin of Error in Excel empowers you to make informed decisions based on your data. By understanding the concept, applying it to real-world scenarios, and exploring advanced techniques, you can elevate your data analysis skills to new heights. Remember, Margin of Error is a valuable tool for quantifying uncertainty and ensuring the reliability of your estimates.


