Master Excel's Pivot Table Editing in a Flash

Pivot tables are an indispensable tool for data analysis in Excel, offering a dynamic and efficient way to summarize large datasets. This comprehensive guide will delve into the art of pivot table editing, showcasing how to harness Excel's capabilities to create, manipulate, and customize pivot tables with precision and ease.
The Power of Pivot Tables

Excel’s pivot tables are a versatile feature, allowing users to transform raw data into meaningful insights with just a few clicks. They enable quick data aggregation, calculation, and presentation, making them an essential tool for data professionals, analysts, and even casual Excel users.
A Step-by-Step Guide to Creating Pivot Tables
To begin, open your Excel workbook and select the data range you wish to analyze. Navigate to the “Insert” tab on the ribbon and click on “PivotTable”. Excel will present you with a dialogue box to confirm your data range and the destination for your pivot table. Once confirmed, Excel will generate a blank pivot table alongside your data, ready for customization.
Next, in the "PivotTable Fields" pane on the right, drag and drop fields from your data range into the "Rows", "Columns", "Values", or "Filters" sections. This will structure your pivot table, with rows and columns representing different data categories, values representing the data to be analyzed, and filters allowing you to refine your data view.
| Data Fields | Pivot Table Sections |
|---|---|
| Region | Rows |
| Product | Columns |
| Sales Amount | Values |
| Date | Filters |

Advanced Pivot Table Editing Techniques
Excel’s pivot table editing goes beyond the basics. Here are some advanced techniques to refine and customize your pivot tables:
- Grouping and Ungrouping Data: Excel allows you to group data items, such as dates or numeric values, to provide higher-level summaries. To group, select the data items you wish to group, right-click, and choose "Group". For ungrouping, right-click on the grouped items and select "Ungroup".
- Customizing Value Calculations: By default, Excel sums values in the "Values" section. However, you can change this to count, average, or other calculations. Right-click on a value field, select "Value Field Settings", and choose your preferred calculation.
- Adding Grand Totals and Subtotals: To add grand totals or subtotals to your pivot table, right-click on a row or column header and select "Show Grand Totals" or "Show Subtotals". This provides a quick summary of your data.
- Customizing Data Appearance: Excel offers various formatting options to enhance the visual appeal of your pivot table. You can change number formats, apply conditional formatting, and even insert charts directly within your pivot table.
Troubleshooting Common Pivot Table Issues
While pivot tables are powerful, they can sometimes present challenges. Here are some common issues and their solutions:
- Missing Data Fields: If a data field is missing from the "PivotTable Fields" pane, ensure that it is part of your selected data range. If not, you can manually add it by clicking on "Add This Data to the Data Model" in the "Data" tab.
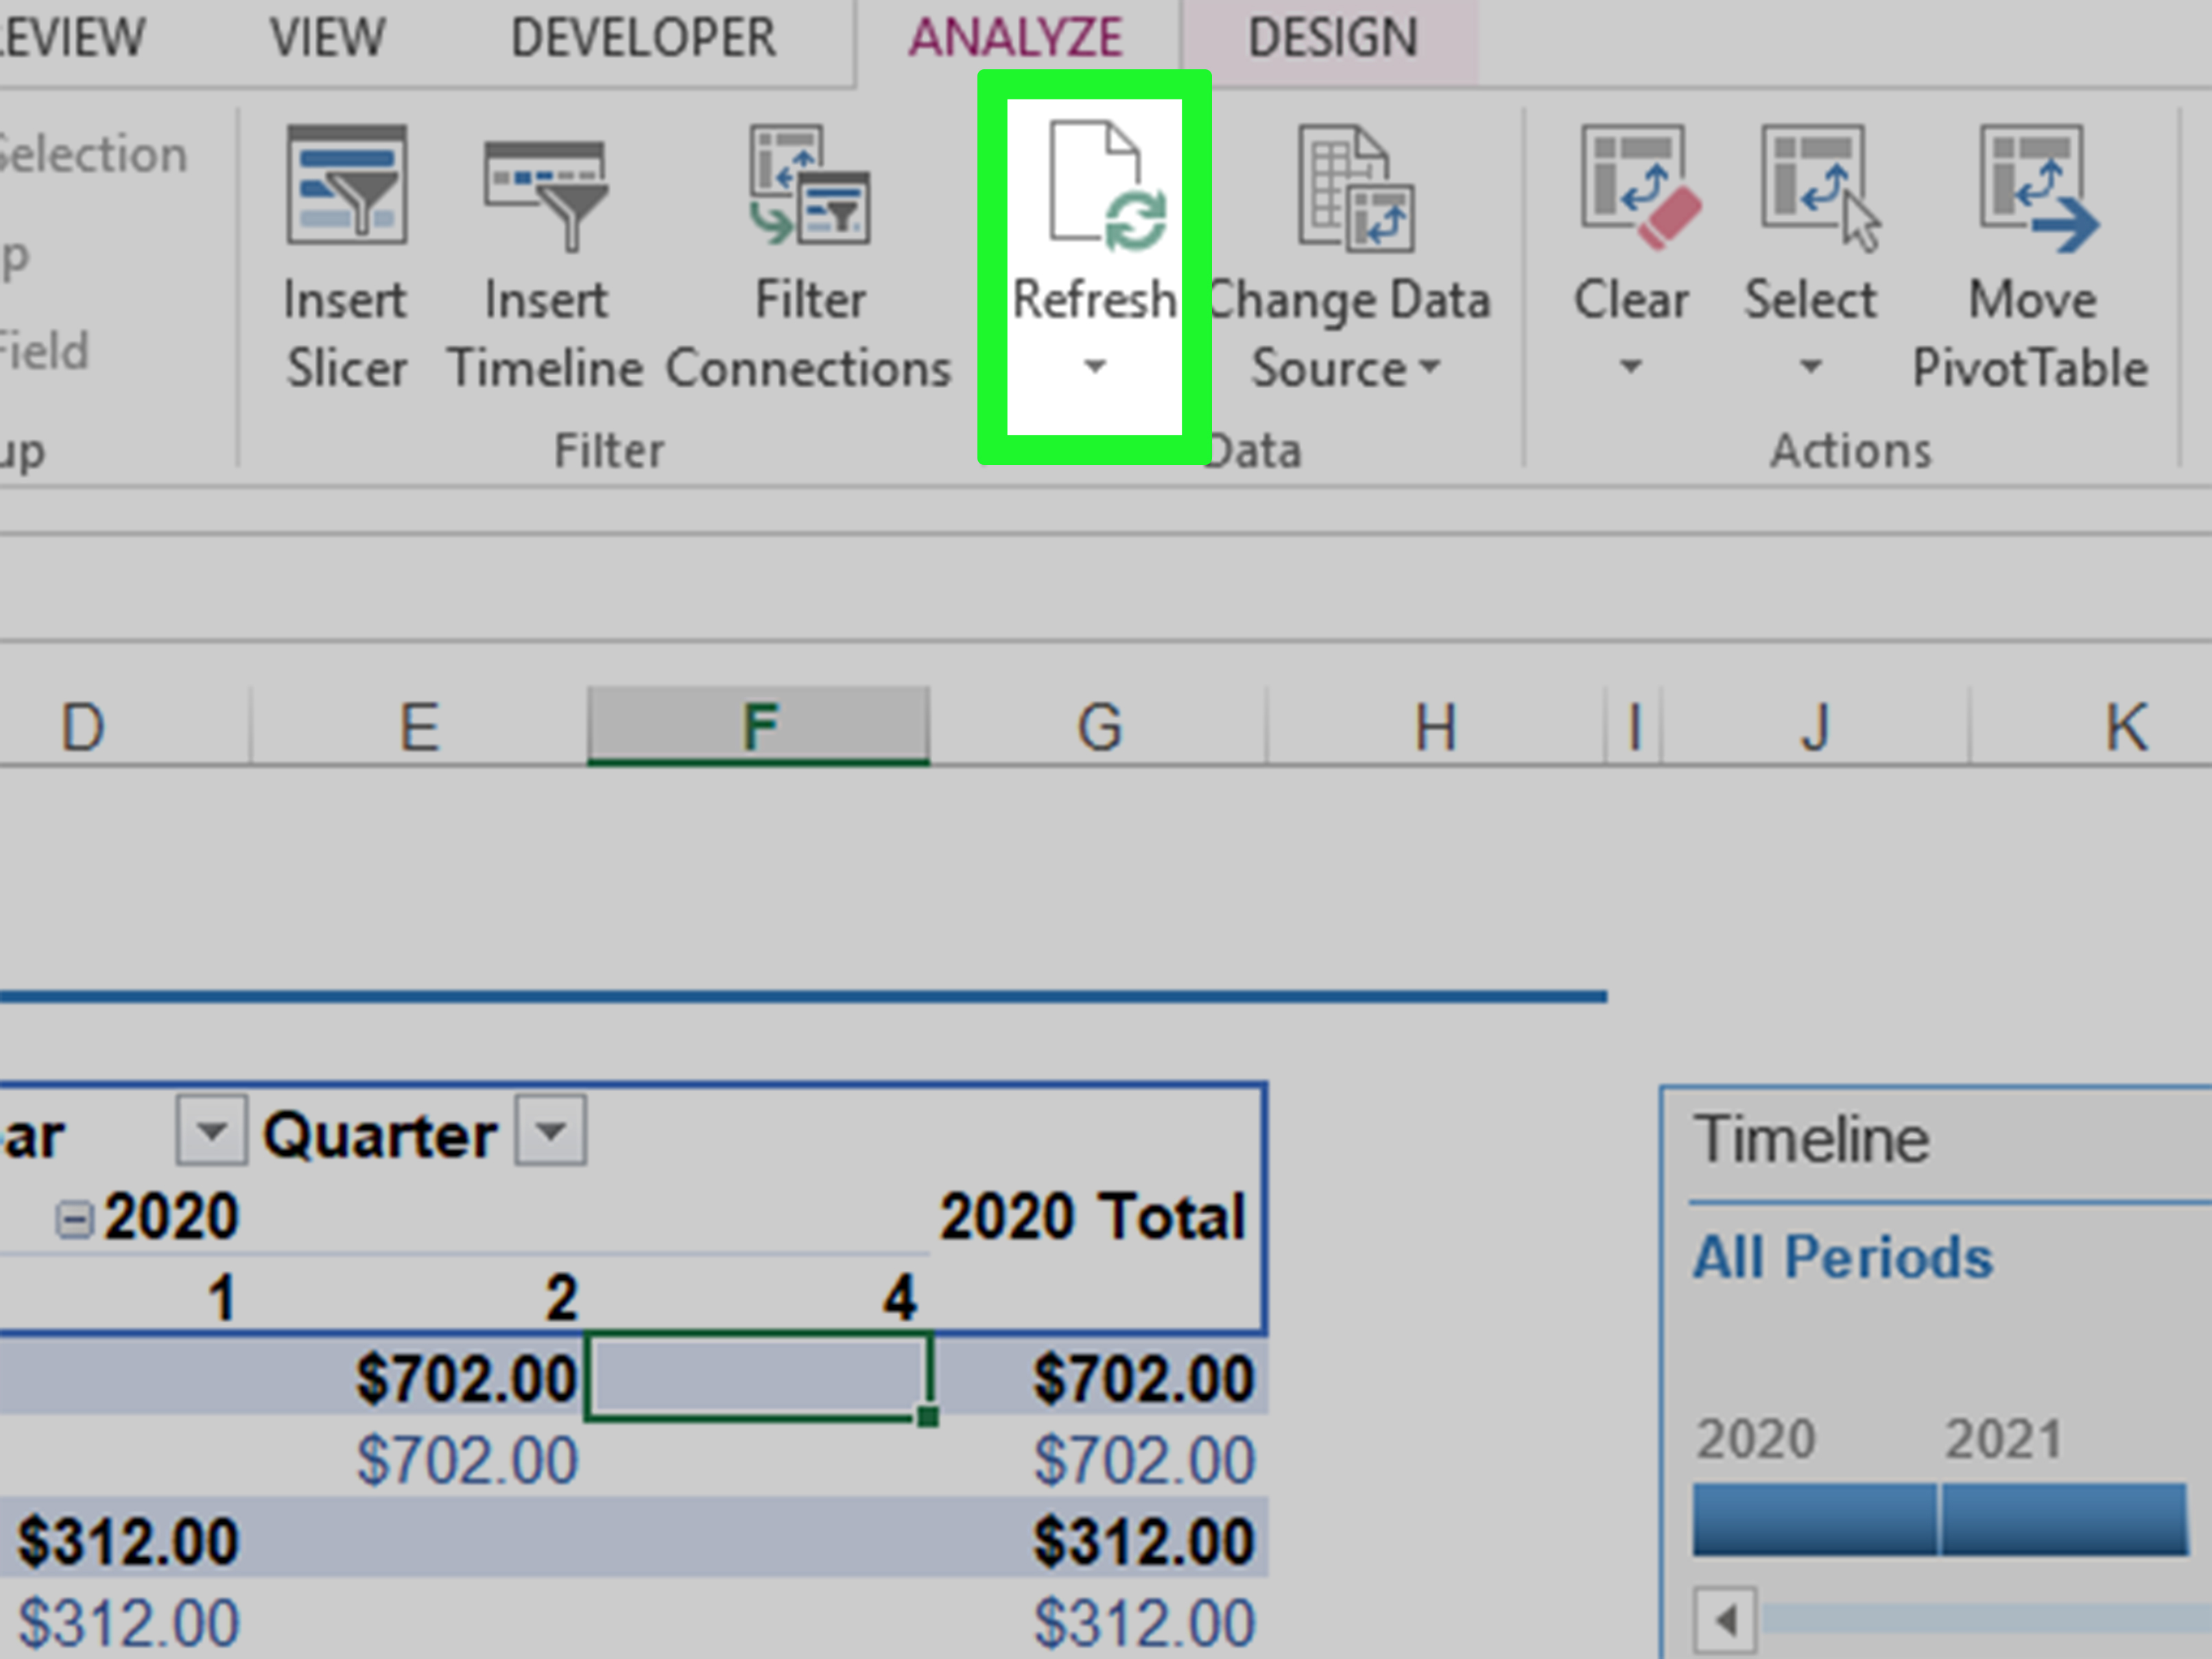
- Unresponsive Pivot Table Updates: Excel's automatic pivot table updates can sometimes lag. To force an update, right-click on the pivot table and select "Refresh" or use the "Refresh" button on the "Analyze" tab.
- Pivot Table Errors: If you encounter errors in your pivot table, such as #VALUE or #DIV/0, check your data for inconsistencies or missing values. Excel's error checking tools, accessible from the "Formulas" tab, can help identify and resolve these issues.
Conclusion: Mastering Pivot Table Editing

Excel’s pivot tables are a powerful tool for data analysis, offering a dynamic and flexible way to explore and present your data. By understanding the basics of pivot table creation and mastering advanced editing techniques, you can unlock the full potential of Excel for data manipulation and insight generation.
Can I create multiple pivot tables from the same data range?
+Absolutely! Excel allows you to create multiple pivot tables from a single data range. Each pivot table can be customized independently, providing different views and insights into your data.
How can I filter my pivot table data dynamically?
+You can use the “Filters” section in the “PivotTable Fields” pane to add dynamic filters to your pivot table. Simply drag and drop the desired filter field into the “Filters” section, and Excel will provide a filter dropdown in your pivot table, allowing you to refine your data view.
What are some best practices for pivot table design and layout?
+When designing pivot tables, consider your audience and the specific insights you wish to convey. Keep your pivot table layout simple and intuitive, with clear labels and a logical structure. Use formatting and conditional formatting to highlight important data points and make your pivot table visually appealing.


