Master Excel: Count Visible Rows in a Snap

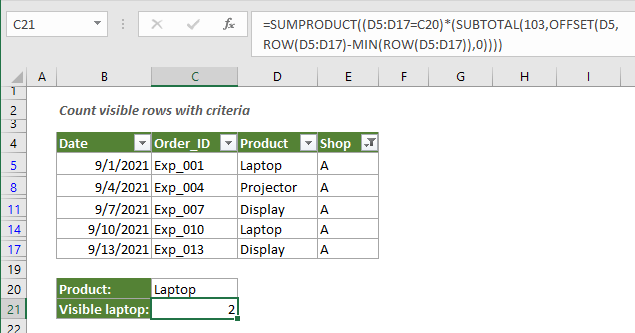
Excel, the ubiquitous spreadsheet software, is an indispensable tool for data analysis and management. However, as datasets grow larger and more complex, it becomes crucial to master the art of navigating and extracting insights efficiently. One common task that often stumps even experienced users is counting the number of visible rows in a filtered or sorted dataset.
In this comprehensive guide, we will delve into the intricacies of Excel's row visibility functions, offering a step-by-step approach to counting visible rows accurately. By the end of this article, you'll be equipped with the knowledge and skills to tackle this task with confidence, saving time and effort in your data analysis workflows.
Understanding Row Visibility in Excel

Before we dive into the methods for counting visible rows, let’s establish a clear understanding of what constitutes a visible row in Excel. A visible row is simply a row that is displayed on the screen, free from any filters or hidden states. In other words, it is a row that is currently active and accessible for analysis or manipulation.
When working with large datasets, applying filters or sorting the data is a common practice to focus on specific subsets of information. These actions can make certain rows hidden or inaccessible, thereby reducing the total number of visible rows. Accurately counting these visible rows is essential for various tasks, such as calculating statistics, applying formulas, or generating reports.
Method 1: Using Excel’s SUBTOTAL Function

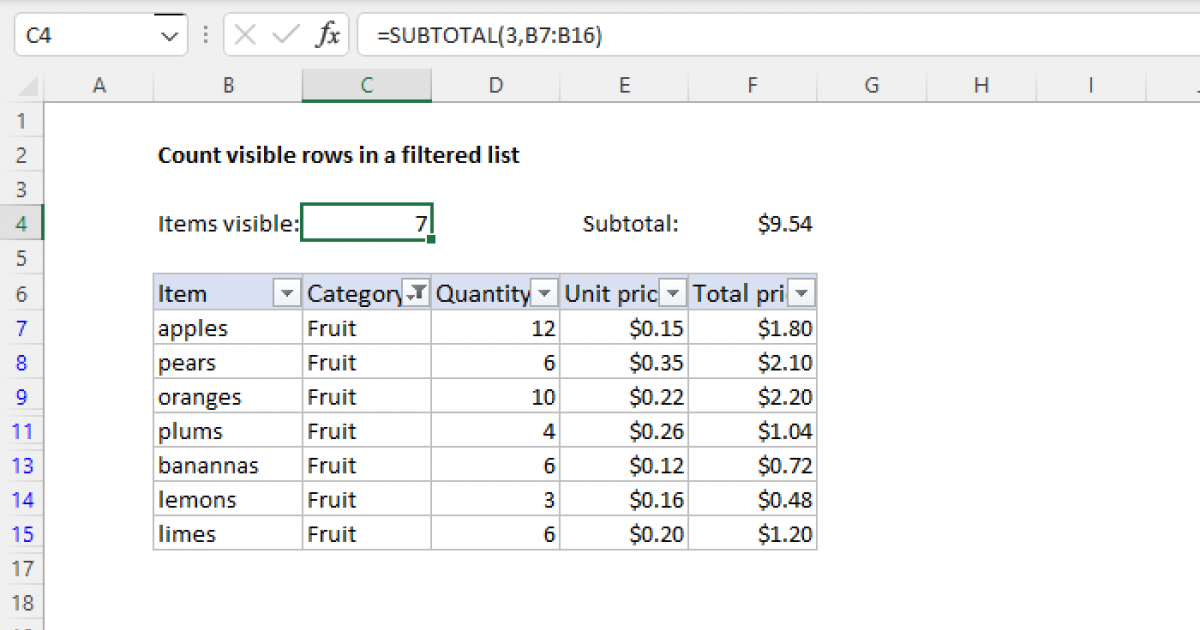
One straightforward method to count visible rows in Excel is by employing the SUBTOTAL function. This function is designed to calculate various statistical values, including counting visible cells or rows, based on specific criteria.
Here's a step-by-step guide on how to use the SUBTOTAL function to count visible rows:
- Insert the SUBTOTAL Function: In a blank cell adjacent to your dataset, enter the formula
=SUBTOTAL(3,B2:B100), replacingB2:B100with the range of cells you want to count. The number3represents the COUNT function within the SUBTOTAL formula. - Apply Filters (Optional): If your dataset is filtered, ensure that the filter is applied before inserting the SUBTOTAL formula. This will ensure that the count is accurate for the visible rows.
- Interpret the Result: The SUBTOTAL function will return the number of visible rows in the specified range. This method is particularly useful for quickly obtaining a count of visible rows without the need for additional formulas or macros.
Method 2: Custom Function for Visible Row Count
While the SUBTOTAL function is a convenient built-in tool, sometimes a more customizable approach is preferred. In such cases, creating a custom function can offer greater flexibility and control over the counting process.
Let's explore how to create a custom function to count visible rows in Excel:
- Create a New Function: Open the Visual Basic Editor by pressing
ALT + F11or navigating to the Developer tab and selecting Visual Basic. In the VBA Editor, insert a new module by clicking Insert and selecting Module. - Write the Function Code: In the new module, paste the following code snippet:
Function CountVisibleRows(rng As Range) As Long
  CountVisibleRows = Application.WorksheetFunction.Subtotal(3, rng)
End Function
This code defines a custom function
CountVisibleRowsthat accepts a range argument and returns the count of visible rows within that range using the SUBTOTAL function. - Use the Custom Function: Back in Excel, enter the formula
=CountVisibleRows(B2:B100)in a blank cell, replacingB2:B100with your desired range. The custom function will now return the count of visible rows within that range.
Method 3: Advanced Row Visibility Techniques
For more complex scenarios or advanced users, Excel offers additional techniques to handle row visibility and counting. These methods involve utilizing VBA macros and custom code to achieve precise results.
One such approach is to create a VBA macro that iterates through each row in a dataset, checking its visibility status and maintaining a running count. While this method may be more involved, it provides a high level of customization and control over the counting process.
Here's a simplified example of a VBA macro that counts visible rows:
Sub CountVisibleRows()
  Dim ws As Worksheet
  Dim rowCount As Long
  Dim row As Long

  Set ws = ActiveSheet 'Change this to a specific worksheet if needed

  rowCount = 0
  For row = 1 To ws.UsedRange.Rows.Count
    If Not ws.Rows(row).Hidden Then
      rowCount = rowCount + 1
    End If
  Next row

  MsgBox "Visible Rows: " & rowCount
End Sub
This macro iterates through each row in the active worksheet's UsedRange, checking if the row is hidden. If a row is visible, it increments the rowCount variable, which is then displayed in a message box.
Best Practices and Considerations

When working with row visibility and counting in Excel, it’s essential to keep a few best practices in mind to ensure accurate and efficient results:
- Maintain Consistent Data Structure: Ensure that your dataset follows a consistent structure with no blank rows or hidden rows that may interfere with the counting process.
- Use Absolute References: When creating formulas or macros, use absolute references (e.g.,
$B$2) to ensure that the range remains fixed, even if the formula is copied to other cells. - Test with Sample Data: Before applying any counting methods to large datasets, test the formulas or macros on a smaller sample to verify their accuracy and performance.
- Consider Performance Impact: While VBA macros can offer advanced control, they may impact Excel's performance, especially with large datasets. Balance functionality with performance considerations.
Conclusion: Mastering Row Visibility for Efficient Data Analysis
Excel’s row visibility functions are powerful tools for data analysts and professionals working with large datasets. By understanding the different methods outlined in this guide, you can confidently tackle the task of counting visible rows, whether through built-in functions, custom formulas, or advanced VBA macros.
Remember, efficient data analysis relies on mastering the intricacies of Excel's features. With the techniques presented here, you'll be well-equipped to handle row visibility and counting with precision and ease.
FAQ
How do I apply filters to my dataset in Excel?
+To apply filters in Excel, select the data range you want to filter, then navigate to the Data tab and click on Filter. This will add filter dropdowns to the headers of your dataset, allowing you to select specific criteria to display.
Can I count visible rows in multiple ranges at once?
+Yes, you can count visible rows in multiple ranges by combining the SUBTOTAL function with the SUM function. For example, =SUM(SUBTOTAL(3,B2:B100), SUBTOTAL(3,C2:C50)) will calculate the sum of visible rows in both ranges.
Are there any limitations to the SUBTOTAL function for counting visible rows?
+The SUBTOTAL function is a powerful tool, but it has a few limitations. It cannot count visible rows in multiple non-adjacent ranges, and it may not work correctly with certain advanced filtering or sorting techniques. In such cases, VBA macros or custom functions may be more suitable.


