Compound Interest: Your Excel Companion

Compound Interest: Unlocking the Power of Excel for Financial Growth

In the world of personal finance and investments, understanding compound interest is crucial for anyone seeking to grow their wealth over time. This powerful concept can significantly impact your financial journey, and Microsoft Excel serves as an invaluable tool to help you grasp and harness its potential. By utilizing Excel's capabilities, you can calculate, visualize, and optimize your investments, making informed decisions to maximize your returns.
This article delves into the world of compound interest, exploring its intricacies and showcasing how Excel can be your trusted companion on the path to financial success. Through practical examples, industry insights, and step-by-step guides, we aim to empower you with the knowledge and skills to navigate the world of compound interest with confidence.
Whether you're a seasoned investor or just starting your financial journey, this comprehensive guide will provide you with the tools and understanding needed to make compound interest work for you. So, let's embark on this journey together and unlock the full potential of compound interest with Excel as our guide.
Understanding Compound Interest: The Foundation of Financial Growth

Compound interest is a fundamental concept in finance, and it plays a pivotal role in the growth of your investments. Unlike simple interest, which is calculated only on the initial principal amount, compound interest takes into account the interest earned on previously earned interest. This compounding effect has the potential to exponentially increase your wealth over time.
The power of compound interest lies in its ability to generate interest on interest, creating a snowball effect. As your investment grows, the interest earned on the original principal amount is added to the balance, and subsequently, interest is calculated on this new, larger amount. This cycle continues, leading to substantial growth over the long term. For instance, an investment of $10,000 at a 5% annual interest rate, compounded annually, would grow to $16,288.95 after 10 years.
| Year | Principal | Interest | Total |
|---|---|---|---|
| 1 | $10,000 | $500 | $10,500 |
| 2 | $10,500 | $525 | $11,025 |
| 3 | $11,025 | $551.25 | $11,576.25 |
| 4 | $11,576.25 | $578.81 | $12,155.06 |
| 5 | $12,155.06 | $607.75 | $12,762.81 |
| 6 | $12,762.81 | $638.14 | $13,400.95 |
| 7 | $13,400.95 | $670.05 | $14,071 |
| 8 | $14,071 | $703.55 | $14,774.55 |
| 9 | $14,774.55 | $738.73 | $15,513.28 |
| 10 | $15,513.28 | $775.66 | $16,288.94 |

As illustrated in the table, the initial investment of $10,000 grows to over $16,000 in just a decade, showcasing the magic of compound interest. This example highlights the potential for substantial growth, especially over extended periods, which is why understanding and utilizing compound interest is essential for long-term financial planning.
The Time Value of Money and Compounding
The concept of time value of money is closely intertwined with compound interest. It recognizes that money has the potential to grow over time, and its value in the future is generally worth more than its value today. This principle is at the heart of financial planning and investment strategies, as it underscores the importance of starting early and letting your money work for you.
By investing and allowing your money to compound over time, you can leverage the time value of money to your advantage. The longer your investments have to grow, the more significant the compounding effect becomes. This is why starting early, even with small amounts, can lead to substantial wealth accumulation over a lifetime.
Excel: Your Ultimate Tool for Mastering Compound Interest
Excel, the ubiquitous spreadsheet software, is an indispensable tool for anyone looking to understand and work with compound interest. With its powerful calculation capabilities and versatile formatting options, Excel allows you to model, analyze, and optimize your investment strategies with ease.
Calculating Compound Interest in Excel
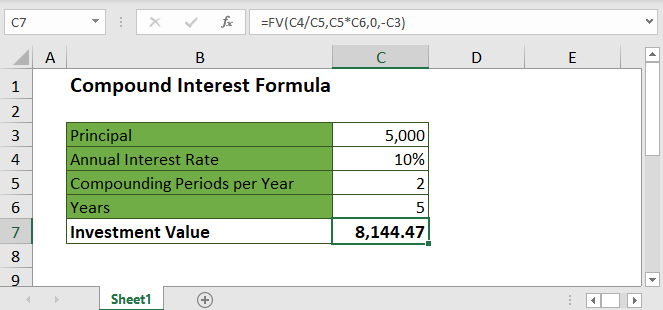
One of the most basic yet powerful functions in Excel for compound interest calculations is the FV (Future Value) function. This function allows you to determine the future value of an investment, taking into account the initial principal amount, interest rate, number of compounding periods, and additional contributions. Here's how it works:
FV(rate, nper, pmt, pv, [type])
- rate: The interest rate per period.
- nper: The total number of compounding periods.
- pmt: The amount of payment made each period. Set to 0 if there are no additional payments.
- pv: The present value, or the initial investment amount.
- [type]: An optional argument. 0 for end-of-period payments (default), and 1 for beginning-of-period payments.
Let's illustrate this with an example. Suppose you want to calculate the future value of an investment of $5,000 at a 6% annual interest rate, compounded monthly, with an additional monthly contribution of $100, over a period of 5 years. Here's how you'd set up the formula:
=FV(6%/12, 5*12, -100, 5000, 0)
The result of this formula would be the future value of your investment after 5 years, which is approximately $7,766.29. This calculation demonstrates how Excel can quickly and accurately compute the effects of compound interest on your investments.
Visualizing Compound Interest with Excel Charts
Excel's charting capabilities offer a powerful way to visualize the growth of your investments over time. By creating a line chart or an area chart, you can easily illustrate the compounding effect and track the progress of your investment journey.
For instance, let's use the same example as above. We can create a line chart with the years on the x-axis and the investment value on the y-axis. This visual representation will show the steady growth of the investment, making it easy to comprehend the impact of compound interest.
Furthermore, Excel allows you to customize these charts with labels, legends, and titles to make them more informative and aesthetically pleasing. You can also use different chart types to highlight specific aspects of your investment strategy, such as comparing the growth of multiple investments or tracking the impact of different interest rates.
Optimizing Your Investment Strategy with Excel Formulas
Excel offers a wide range of formulas and functions that can help you optimize your investment strategy. By utilizing these tools, you can perform sensitivity analyses, what-if scenarios, and goal-seeking calculations to make informed decisions about your investments.
For example, you can use the Goal Seek feature in Excel to find the interest rate or contribution amount needed to achieve a specific future value. This is especially useful when you have a financial goal in mind and want to determine the steps required to reach it. Similarly, you can use Excel's Solver tool to optimize more complex investment scenarios, such as optimizing a portfolio with multiple assets and constraints.
Additionally, Excel's Data Table feature allows you to quickly analyze the impact of changing variables on your investment. By creating a data table, you can instantly see how different interest rates, contribution amounts, or time periods affect the future value of your investment, enabling you to make more informed decisions about your financial strategies.
Real-World Applications and Case Studies
To illustrate the practical applications of compound interest and Excel, let's explore a few real-world scenarios and case studies.
Saving for Retirement
Compound interest is a powerful tool for retirement planning. By starting early and consistently contributing to your retirement savings, you can leverage the time value of money and the compounding effect to build a substantial nest egg. Excel can help you model different retirement scenarios, such as the impact of varying contribution amounts, interest rates, and time horizons, to ensure you're on track to meet your retirement goals.
Investing in the Stock Market
The stock market offers the potential for significant returns over time, and compound interest can play a crucial role in growing your investments. Excel can assist you in tracking and analyzing your stock market investments, allowing you to monitor the performance of individual stocks, calculate returns, and assess the overall growth of your portfolio. By utilizing Excel's functions and charts, you can make informed decisions about buying, selling, and rebalancing your portfolio to optimize your investment strategy.
Paying Off Debt
Compound interest can also be a double-edged sword when it comes to debt. If you have loans or credit card balances, the compounding effect can work against you, leading to higher interest payments and longer repayment periods. Excel can help you understand the impact of compound interest on your debt and develop strategies to pay it off more efficiently. By using Excel's financial functions, you can calculate the true cost of your debt and explore different repayment scenarios to find the most effective approach.
Tips and Best Practices for Excel and Compound Interest

As you embark on your journey to master compound interest with Excel, here are some tips and best practices to keep in mind:
- Start early: The power of compound interest is amplified when you start investing early. The longer your money has to grow, the more significant the compounding effect becomes.
- Be consistent: Consistent contributions to your investments, whether it's a monthly contribution to your retirement account or regular purchases of stocks, can significantly impact the growth of your wealth over time.
- Use realistic rates: When modeling compound interest, use realistic interest rates that align with your investment goals and the current market conditions. This ensures that your calculations and projections are accurate and achievable.
- Regularly review and update your models: Financial markets and interest rates can fluctuate, so it's essential to regularly review and update your Excel models to ensure they reflect the current economic landscape.
- Explore different scenarios: Excel's versatility allows you to model various investment scenarios and what-if analyses. Take advantage of this capability to explore different strategies and understand the potential outcomes before making financial decisions.
Excel Shortcuts and Tips
To enhance your Excel experience and streamline your calculations, here are a few keyboard shortcuts and tips to keep in mind:
- Ctrl + D: Fill down - Quickly copy the formula in the active cell to the cells below it.
- Ctrl + R: Fill right - Copy the formula in the active cell to the cells to the right.
- Ctrl + C: Copy - Copy the selected cell(s) or range.
- Ctrl + V: Paste - Paste the copied content.
- Ctrl + Z: Undo - Undo the last action.
- Ctrl + Y: Redo - Redo an undone action.
- Ctrl + Shift + % : Percentage - Formats the selected cell(s) as percentages.
- F2: Edit cell - Enters edit mode in the active cell.
- Ctrl + 1: Format cells - Opens the Format Cells dialog box to customize cell formatting.
Conclusion: Excel and Compound Interest - A Powerful Combination
Compound interest is a cornerstone of financial growth, and Excel is the ideal tool to help you harness its power. By understanding the fundamentals of compound interest and leveraging Excel's capabilities, you can make informed decisions, optimize your investment strategies, and achieve your financial goals.
Throughout this article, we've explored the concept of compound interest, delved into Excel's powerful features for financial calculations and analysis, and showcased real-world applications. We hope that this guide has empowered you to take control of your financial future and make compound interest work for you.
Remember, starting early, being consistent, and using Excel to your advantage are key ingredients in the recipe for financial success. With compound interest as your ally and Excel as your trusted companion, you're well on your way to building a prosperous financial future.
How does compound interest differ from simple interest?
+Compound interest differs from simple interest in that it takes into account the interest earned on previously earned interest. In simple interest, interest is calculated only on the initial principal amount, whereas in compound interest, the interest is calculated on the principal plus the accumulated interest over time. This compounding effect leads to exponential growth of the investment over time.
Can compound interest work against me in the case of debt?
+Yes, compound interest can work against you when it comes to debt. If you have loans or credit card balances, the compounding effect can lead to higher interest payments and longer repayment periods. It’s important to understand the impact of compound interest on your debt and develop strategies to pay it off efficiently.
What is the best way to utilize Excel for compound interest calculations?
+Excel provides a range of functions and features to assist with compound interest calculations. The FV (Future Value) function is particularly useful for determining the future value of an investment. Additionally, Excel’s charting capabilities allow you to visualize the growth of your investments over time. You can also use Excel’s Goal Seek and Solver tools to optimize your investment strategy and perform what-if analyses.


